Who votes with whom
Three ways to explore how council members vote together. All of them count only the 73 recorded votes that were not unanimous, from 42 meetings.
Voting Alliance Network
Councillors are connected based on how frequently they voted the same way on votes both attended. Thicker lines indicate stronger agreement, while colours represent groups identified through voting-pattern analysis. These groups reflect observed voting similarities, not necessarily political affiliations.
How this network is built
Lines and percentages come straight from the votes: of the 73 non-unanimous recorded votes, the share both people attended on which they voted the same way. Pairs who never voted together have no line, because that is unknown rather than 0%.
Positions: every known pair pulls toward a distance set by its agreement, including pairs below the slider, so moving the slider never rearranges the network. Layout starts from fixed positions, so it comes out the same on every visit.
Communities use the Louvain method on the full network, whatever the slider says. On average, any two members here agree 65% of the time, and with raw percentages those moderate links would blur everything into one group. So only agreement above that average counts as a link, and an unknown pair counts as no evidence either way. Modularity is 0.25, where 0 means no community structure, so these communities are real but overlapping.
How firm they are: on 300 random resamples of the votes, 3 communities came out 63% of the time. Each person's detail panel shows how often they stayed with their community. Bridging marks someone whose average agreement within their community is less than 10 points above their average with everyone else; that cutoff is a judgement call.
These communities can differ from the voting groups further down the page, which use a different method. Comparing the two shows which memberships are firm: people in the same group under both are the most consistent allies.
Agreement circle
The thicker the line, the larger the share of votes on which two council members voted the same way.
Select a name to see only their lines, or select a line for its count.
Agreed most
Agreed least

Mayor Cam Guthrie
Mayor · how often they voted the same way as each colleague
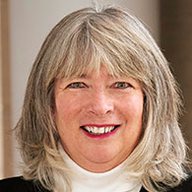
Michele Richardson
Ward 3 · how often they voted the same way as each colleague

Dominique O'Rourke
Ward 6, until 2025 · how often they voted the same way as each colleague

Erin Caton
Ward 1 · how often they voted the same way as each colleague
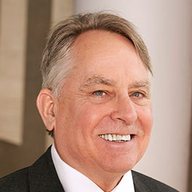
Phil Allt
Ward 3 · how often they voted the same way as each colleague

Linda Busuttil
Ward 4 · how often they voted the same way as each colleague

Katherine Hauser
Ward 6, since July 2025 · how often they voted the same way as each colleague
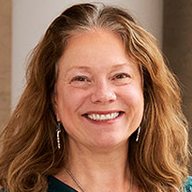
Leanne Caron
Ward 5 · how often they voted the same way as each colleague
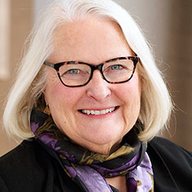
Cathy Downer
Ward 5 · how often they voted the same way as each colleague

Carly Klassen
Ward 2 · how often they voted the same way as each colleague
Rodrigo Goller
Ward 2 · how often they voted the same way as each colleague

Ken Yee Chew
Ward 6 · how often they voted the same way as each colleague

Dan Gibson
Ward 1 · how often they voted the same way as each colleague
Christine Billings
Ward 4 · how often they voted the same way as each colleague
Voting groups
Each portrait is a council member. The closer two portraits are, the more often those two voted the same way. Hover over or select someone to see how often they agreed with each colleague, as a percentage of these votes that both attended. The groups agree with each other on only 55% of these votes.
Group A
Agree with each other on 80% of these votes. Dominique O'Rourke fits this group least firmly.
Phil AlltLinda BusuttilErin CatonLeanne CaronKatherine HauserCathy DownerCarly KlassenDominique O'RourkeGroup B
Agree with each other on 76% of these votes.
Christine BillingsKen Yee ChewDan GibsonMichele RichardsonMayor Cam GuthrieBetween the groups
About as close to one group as the other.
Rodrigo GollerHow the groups were found
Starting from how often each pair disagreed, multidimensional scaling placed everyone on this plane; two dimensions hold about 76% of the differences, so distances are close but not exact. Hierarchical clustering (average linkage) then formed the groups, and the silhouette score chose how many: 2 groups 0.44, 3 groups 0.42, 4 groups 0.33, 5 groups 0.33, where higher means better separated. Clustering used the full data, not the 2D positions.
To test this, we re-ran it on 1,000 random resamples of the 73 votes. 2 groups came out best in 72% of them, and members of a group stayed together 92% to 94% of the time. Rodrigo Goller is shown between them because their silhouette score is 0.03, below our 0.1 cutoff; in the resamples they land with Group A 51% of the time and B 38% of the time. Dominique O'Rourke is the loosest fit, with a silhouette of 0.29 (everyone else in a group is 0.34 or higher), and lands with Group A in 81% of resamples.
People who never voted together have no real distance, so theirs is estimated from how alike they are with everyone else. With 73 votes these are working patterns, not fixed blocs. Left and right on the map come from the maths and don't mean political left and right. Portraits with near-identical records are eased apart so each can be seen, so very small gaps mean nothing. Group names are arbitrary.
The numbers
Every pair, as a table
Percent of the votes both attended on which they agreed.
| Mayor Cam Guthrie | Michele Richardson | Dominique O'Rourke | Erin Caton | Phil Allt | Linda Busuttil | Katherine Hauser | Leanne Caron | Cathy Downer | Carly Klassen | Rodrigo Goller | Ken Yee Chew | Dan Gibson | Christine Billings | |
|---|---|---|---|---|---|---|---|---|---|---|---|---|---|---|
| Mayor Cam Guthrie | 72 | 61 | 42 | 46 | 48 | 73 | 56 | 72 | 69 | 51 | 75 | 66 | 75 | |
| Michele Richardson | 72 | 82 | 48 | 54 | 53 | 59 | 62 | 70 | 68 | 62 | 82 | 72 | 75 | |
| Dominique O'Rourke | 61 | 82 | 74 | 72 | 70 | 85 | 82 | 82 | 62 | 80 | 54 | 60 | ||
| Erin Caton | 42 | 48 | 74 | 83 | 83 | 77 | 79 | 70 | 67 | 45 | 44 | 32 | 35 | |
| Phil Allt | 46 | 54 | 72 | 83 | 88 | 85 | 78 | 71 | 69 | 49 | 47 | 39 | 35 | |
| Linda Busuttil | 48 | 53 | 70 | 83 | 88 | 86 | 76 | 75 | 71 | 50 | 49 | 38 | 39 | |
| Katherine Hauser | 73 | 59 | 77 | 85 | 86 | 95 | 91 | 95 | 50 | 57 | 41 | 64 | ||
| Leanne Caron | 56 | 62 | 85 | 79 | 78 | 76 | 95 | 85 | 83 | 65 | 61 | 47 | 51 | |
| Cathy Downer | 72 | 70 | 82 | 70 | 71 | 75 | 91 | 85 | 91 | 70 | 72 | 55 | 65 | |
| Carly Klassen | 69 | 68 | 82 | 67 | 69 | 71 | 95 | 83 | 91 | 74 | 76 | 52 | 63 | |
| Rodrigo Goller | 51 | 62 | 62 | 45 | 49 | 50 | 50 | 65 | 70 | 74 | 66 | 46 | 59 | |
| Ken Yee Chew | 75 | 82 | 80 | 44 | 47 | 49 | 57 | 61 | 72 | 76 | 66 | 80 | 86 | |
| Dan Gibson | 66 | 72 | 54 | 32 | 39 | 38 | 41 | 47 | 55 | 52 | 46 | 80 | 79 | |
| Christine Billings | 75 | 75 | 60 | 35 | 35 | 39 | 64 | 51 | 65 | 63 | 59 | 86 | 79 |